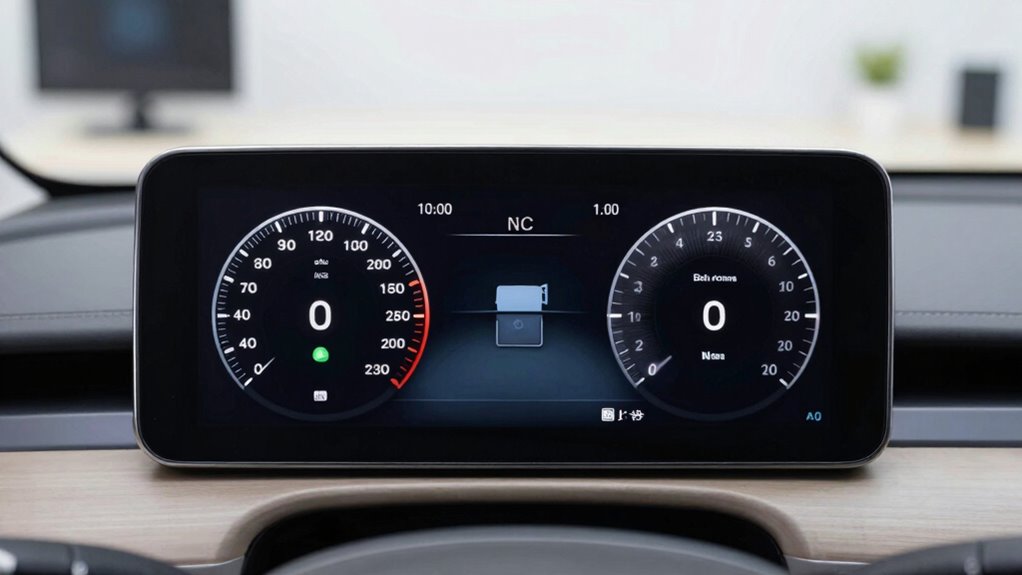

Focusing on fewer metrics helps you avoid information overload and keeps your dashboard clear and easy to interpret. Too many data points can slow your decision-making, obscure critical issues, and distract you from what truly matters—like charge level, temperature, and cycle count. When you streamline your metrics, you gain quicker insights, better identify trends, and proactively manage battery health. If you’re interested, you’ll discover how this approach leads to more efficient and reliable battery management.

Get backup power and energy gear delivered free with Prime
- Fast, free delivery on millions of items
- Prime Video, Amazon Music and more included
- Member-only deals all year
Key Takeaways
- Overloading dashboards with metrics can cause information overload, making it harder to identify critical issues quickly.
- Fewer, focused metrics improve data visualization, enabling clearer trend detection and quicker decision-making.
- Prioritizing essential indicators helps monitor battery health accurately and supports proactive maintenance.
- Simplified dashboards prevent distraction from irrelevant data, ensuring attention remains on vital performance metrics.
- Targeted metrics optimize resource allocation and reduce reaction times, extending battery lifespan effectively.
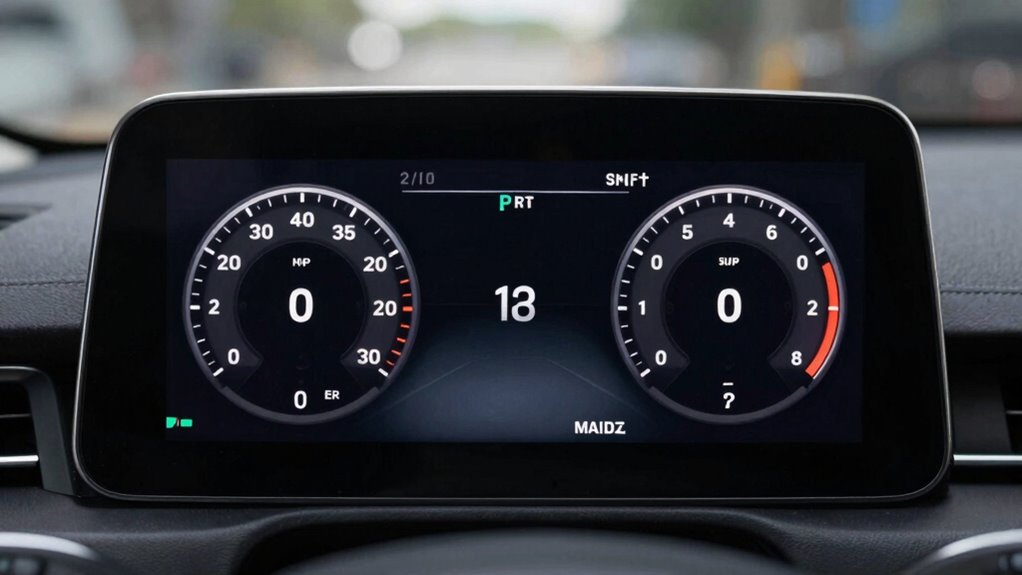
In today’s fast-paced world, more data doesn’t always mean better insights, especially when it comes to battery dashboards. When you’re monitoring battery performance, piling on metrics can quickly become overwhelming, obscuring the key information you need. Instead of tracking every conceivable data point, focus on a handful of essential metrics that truly reflect the health and efficiency of the battery. This approach simplifies data visualization, making it easier for you to identify issues before they escalate and optimize the battery’s lifecycle.
Focusing on key metrics simplifies battery monitoring and helps prevent issues before they become critical.
A cluttered dashboard with dozens of metrics can distract you from the core indicators of battery health. You might find yourself sifting through complex graphs and numbers, losing sight of what matters most. By narrowing your focus, you can develop a clearer picture of how your battery is performing over time. Key metrics such as state of charge, voltage, temperature, and cycle count are often enough to gauge overall health and predict potential failures. These vital data points, when presented cleanly, help you make faster, more informed decisions. Moreover, fewer metrics allow for more effective data visualization techniques, which can highlight trends and anomalies more clearly. Recognizing the importance of focused data can optimize your monitoring strategy and improve decision-making efficiency.
Understanding the battery lifecycle is essential here. Every battery has a finite lifespan, influenced by factors like charge cycles, temperature, and usage patterns. When you track only the most relevant data, you gain insights into where the battery stands in its lifecycle. This targeted data visualization allows you to plan maintenance, replacements, or upgrades proactively, rather than reacting to unexpected failures. It also helps extend your battery’s longevity by highlighting early signs of degradation, so you can act before performance declines sharply.
As an affiliate, we earn on qualifying purchases.
Frequently Asked Questions
How Do Users Prioritize Which Metrics to Display?
You prioritize metrics by focusing on what drives user engagement and aligns with your goals. Consider your team’s customization preferences, selecting only the essential data that offers clear insights without clutter. Ask yourself which metrics users rely on most for decision-making and operational efficiency. By honing in on these key indicators, you create a streamlined dashboard that’s more effective and user-friendly, encouraging better engagement and quicker understanding.
What Are Common Pitfalls of Overloading Dashboards With Data?
You risk data overload and metric clutter when you overload dashboards with too much information. This makes it harder to identify critical insights quickly, leading to confusion and decision fatigue. Overloading can overwhelm users, causing them to overlook essential metrics or misinterpret data. To avoid this, focus on displaying only key metrics that directly impact your goals, ensuring your dashboard remains clear, concise, and actionable.
How Does Simplicity Improve Battery Management Decisions?
Simplicity improves battery management decisions by making critical data easier to interpret, especially through an intuitive user interface. When dashboards focus on key metrics like sensor calibration status, you can quickly identify issues and take corrective actions. A streamlined interface reduces confusion, minimizes errors, and helps you prioritize maintenance, ultimately extending battery life and ensuring reliable performance without getting overwhelmed by excess information.
Are There Industry Standards for Essential Battery Metrics?
You’ll find that industry standards for essential battery metrics focus on charge cycles and battery lifespan. For example, most manufacturers aim for batteries to endure around 300 to 500 charge cycles before significant capacity loss. These standards help you monitor battery health accurately without overwhelming you with data. Simplifying your dashboard to track these key metrics guarantees you make better decisions, prolonging battery life and optimizing performance effectively.
How Can Dashboards Adapt to Different Battery Technologies?
You can adapt dashboards to different battery technologies through customization. By tailoring metrics to specific battery types, you guarantee relevant data is front and center. Incorporate features that allow you to modify parameters like voltage, capacity, and temperature. This way, your dashboard becomes a versatile tool that reflects the unique needs of each battery technology, helping you monitor performance accurately and make informed decisions effectively.
Conclusion
By focusing on fewer, more meaningful metrics, your battery dashboard becomes a lighthouse guiding you safely through the fog of data overload. Instead of drowning in numbers, you’ll gain clear insights that help you make smarter decisions and extend your battery’s lifespan. Remember, sometimes less truly is more—like a well-tuned orchestra, a streamlined dashboard hits all the right notes without drowning in noise. Keep it simple, and your battery will thank you.
Fall Picks
fall essentials
As an affiliate, we earn on qualifying purchases.